18. TML Real-Time Dashboards
You can create real-time dashboards using TML binary called Viperviz. These dashboards are integrated with TML solutions and users can build very unique and powerful real-time dashboards using simple HTML and javascript.
Tip
Watch the Youtube Video that shows how to create amazing TML real-time dashboards.
Note
Viperviz streams data directly from the Docker Container to the client browser. Viperviz binary uses websockets to stream data to the browser. This means you do not need a third-party visualization tool.
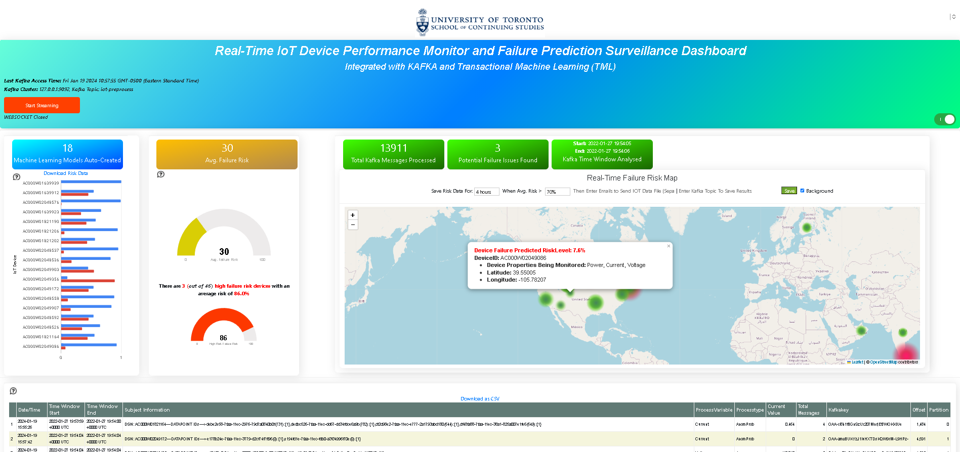
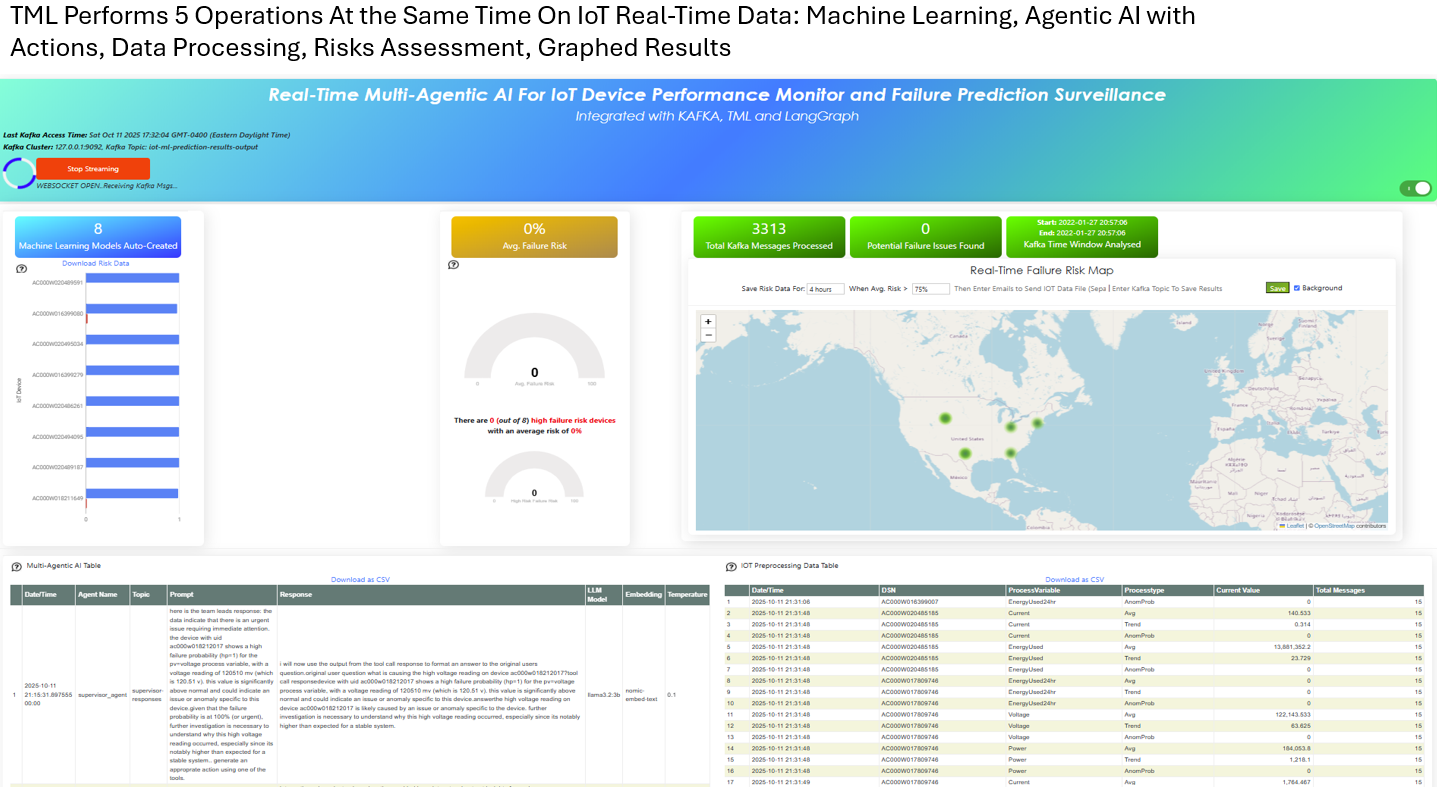
Some sample dashboards samples are below.


18.1. Running Dashboards
18.1.1. Creating Your Own Dashboards
Creating Real-Time Dashboard in TML are simple, yet very powerful and free. No third-party visualization tool is necessary.
Important
All dashboards MUST be created and saved in your <repo>/tml-airflow/dashboard folder as shown in Figure below.
You can also upload any images, javascript, css, etc. to the folders in this location.

Note
Refer to STEP 7: Real-Time Visualization: tml-system-step-7-kafka-visualization-dag for details.
To access your dashboard you must enter the filename of the HTML file (i.e. Your Dashboard file) in the dashboardhtml field in DAG 7.

Once you have created a dashboard to visualize TML data you enter a URL in your browser to run it.
Here is an example URL:
http://localhost:<PORT>/dashboard.html?topic=iot-preprocess&offset=-1&groupid=&rollbackoffset=500&topictype=prediction&append=0&secure=1
Note
When you run your TML solution in TSS by following the instructions here Lets Start Building a TML Solution a visualization URL will be generated for you in your TML solution documentation. A sample documentation is here. A PORT will be assigned to your dashboard at runtime.
URL Key |
Description |
http://localhost:<PORT> |
Almost all of the dashboard will point to the IP and Port that Viperviz is listening on. Viperviz has a built in webserver, so no setup is need, just plug and play. The above URL points to localhost and port 9005 for Viperviz |
dashboard.html |
TML Solution Studio (TSS) provides a template dashboard to get you up and running quickly. This is a base dashboard but will show you how real-time data from TML is analysed and processed. As shown in the above dashboards, you can create amazing dashboards with HTML and Javascript. |
topic=iot-preprocess |
In the topic key you specify the topic you want to consume data from. Viperviz will start consuming from this topic, i.e. iot-preprocess or whatever topic you have created to store your data. Note: You can specify more than one topic to consume from, just separate multiple topics with comma. |
offset=-1 |
This tells Viperviz to start consuming from the latest data in the stream. |
groupid= |
ignored |
rollbackoffset=500 |
This tells Viperviz to rollback the datastream by 500 offsets and send it to the browser. NOTE: While you can increase this number - use it with caution because it may overload your browser. |
topictype=prediction |
Leave as is |
append=0 |
If this is 0, the dashboard will not keep appending new data because it may crash your browser as lots of data accumulates. If you set to 1, then data will append. |
secure=1 |
Secure connection |
Caution
Be careful streaming too many topics at once, and/or, setting the rollbackoffset to a high number because this will cause Viperviz to send a large amout of data to your computer browser, which could overload or crash your browser and/or your computer.
18.2. Dashboard Template
Tip
Here is the dashboard template - you can easily build on this to create your amazing real-time dashboards.
This dashboard is a template that will immediately start to visualize your streaming data. You can add/edit/modify this dashboard to fit your business needs - it is written in simple HTML and Javascript. This template is a great way to quickly get you started with amazing real-time visualizations.
You can modify it in TML Solution Studio (TSS) and commit changes to Github directly from the TSS.

18.3. Dashboard Template: Code Explanation
<!DOCTYPE html>
<html lang="en">
<!--
<head>
<meta charset="UTF-8" />
<link rel="shortcut icon" type="image/x-icon" href="./oticsico.png" />
<title>IoT Device Failure Surveillance Dashboard</title> <!-- CHANGE TITLE HERE -->
<!-- ************************************** START OF STYLE ************************************* -->
<style>
.loader {
border: 7px solid #f3f3f3;
border-radius: 50%;
border-top: 7px solid blue;
border-bottom: 7px solid blue;
width: 70px;
height: 70px;
-webkit-animation: spin 2s linear infinite;
animation: spin 2s linear infinite;
}
@-webkit-keyframes spin {
0% { -webkit-transform: rotate(0deg); }
100% { -webkit-transform: rotate(360deg); }
}
@keyframes spin {
0% { transform: rotate(0deg); }
100% { transform: rotate(360deg); }
}
h1 { font-family: "Avant Garde", Avantgarde, "Century Gothic", CenturyGothic, AppleGothic, sans-serif; font-size: 24px; font-style: normal; font-variant: normal; font-weight: 700; line-height: 26.4px; } h3 { font-family: "Avant Garde", Avantgarde, "Century Gothic", CenturyGothic, AppleGothic, sans-serif; font-size: 12px; font-style: normal; font-variant: normal; font-weight: 100; line-height: 10.4px; } h4 { font-family: "Avant Garde", Avantgarde, "Century Gothic", CenturyGothic, AppleGothic, sans-serif; font-size: 1px; font-style: bold; font-variant: normal; font-weight: 400; line-height: .4px; } p { font-family: "Avant Garde", Avantgarde, "Century Gothic", CenturyGothic, AppleGothic, sans-serif; font-size: 14px; font-style: normal; font-variant: normal; font-weight: 400; line-height: 20px; } blockquote { font-family: "Avant Garde", Avantgarde, "Century Gothic", CenturyGothic, AppleGothic, sans-serif; font-size: 21px; font-style: normal; font-variant: normal; font-weight: 400; line-height: 30px; } pre { font-family: "Avant Garde", Avantgarde, "Century Gothic", CenturyGothic, AppleGothic, sans-serif; font-size: 13px; font-style: normal; font-variant: normal; font-weight: 400; line-height: 18.5714px; }
.a {
background: linear-gradient(to bottom, #33ccff 0%, #ff99cc 100%);
}
.b {
background: linear-gradient(to top left, #ffffff 0%, #ccffff 100%);
}
#gauge_avgrisk {
width:370px; height:380px;
}
#gauge_currrisk {
width:370px; height:380px;
display: inline-block;
margin: 1em;
}
#chart_div {
float: left;
}
body {
justify-content: center;
align-items: center;
}
.orange-background {
background-color: orange;
}
.orchid-background {
background-color: orchid;
}
.beige-background {
background-color: beige;
}
.columnTitle {
font-family: "Helvetica Neue", Helvetica, Arial, sans-serif;
font-size: 14px;
color:white;
background-color: #607A75
}
.grid {
display: grid;
grid-gap: var(--card-padding);
margin: 0 auto;
max-width: 60em;
padding: 0;
@media (min-width: 42em) {
grid-template-columns: repeat(3, 1fr);
}
}
th, td {
padding: 5px;
}
.card {
background-color: #fff;
border-radius: var(--card-radius);
position: relative;
&:hover {
box-shadow: 5px 5px 10px rgba(0, 0, 0, 0.15);
}
}
.plan-type {
color: var(--color-green);
font-size: 1.5rem;
font-weight: bold;
line-height: 1em;
}
.btnsave{
width: 50px;
height: 25px;
background: linear-gradient(to bottom right, #609931, #87bc27);
color: white;
align: top;
}
.padding
{
padding: 4px 5px 2px 2px;
}
#map {
position: relative;
width: 100%;
height: 500px;
}
</style>
<!-- ************************************** END OF STYLE ************************************* -->
<!-- ************************************** START SCRIPTS ************************************* -->
<script type="text/javascript" src="/js/attention.js"></script>
<script type="text/javascript" src="/js/r.min.js"></script>
<script type="text/javascript" src="/js/justgage.js"></script>
<script type="text/javascript" src="/js/justgage.min.js"></script>
<script src="/js/d3.min.js"></script>
<script src="/js/d3pie.js"></script>
<script>
<!-- ********************** HELP TEXT ********************************************** -->
function image(thetype,mess) {
var titletext="";
var helptext="";
if (thetype=="barchart"){
titletext="Failure Monitoring Bar Chart";
helptext="The Failure Monitoring Bar Chart shows the count of Total Failure records in the data stream (GREY Bar), against the Failure that are above the upper bound (BLUE Bar).";
}else if (thetype=="table"){
titletext="Table Data";
helptext="The data in the table shows the preprocessed values for every device used in the preprocessing of IoT Device data. KAFKAKEY is a unique hash key for the Kafka message. OFFSET/PARTITION show the actual location of the PROCESSED message in Kafka. By PROCESSED we mean the MAX and AVG value process. Time Window Start and End are the start and end of the Time Sliding Window in the data stream that is processed to compute MAX and AVG fo devices. Date/Time is when this processing took place by VIPER.";
}else if (thetype=="ml"){
titletext="Transactional Machine Learning Models";
helptext="These are the ML models TML has built for every device. They are Failure Probability predictions. TML creates a logistic regression model for each device.";
}
new Attention.Prompt({
title: titletext,
content: helptext,
});
}
</script>
<!-- ************************************** END SCRIPTS ************************************************************ -->
<link rel="stylesheet" href="/leaflet/leaflet.css" />
<link href="https://stackpath.bootstrapcdn.com/bootstrap/4.3.1/css/bootstrap.min.css" rel="stylesheet" integrity="sha384-ggOyR0iXCbMQv3Xipma34MD+dH/1fQ784/j6cY/iJTQUOhcWr7x9JvoRxT2MZw1T" crossorigin="anonymous">
<link href="/css/tilesblockchain.css" rel="stylesheet">
<link href="/css/attention.css" rel="stylesheet">
<link href="/css/button.css" rel="stylesheet">
<link href="/css/textbox.css" rel="stylesheet">
<link href="/css/table3d.css" rel="stylesheet">
<link href="/css/dropdown.css" rel="stylesheet">
<link href="/css/component-custom-switch.css" rel="stylesheet">
</head>
<!-- ******************************************************* END OF HEAD ******************************************* -->
<!-- ******************************************************* START WEBSITE BODY ******************************************* -->
<body>
<!-- ********************************************************* DASHBOARD HEADER ******************************************** -->
<table style="width: 100%;height: 80px; background: linear-gradient(135deg, rgba(102, 255, 217,1) 0%,rgba(0, 128, 255,1) 50%,rgba(0, 128, 255,1) 51%,rgba(0, 255, 128,1) 100%);">
<tr>
<td>
<div class="row justify-content-md-center">
<center>
<div class="col-12" style="padding-top: 1px">
<label id="maintitle"><b><h1><i><font color='white'><b>Real-Time Dashboard Template</b></h1><h3><i>Integrated with Apache KAFKA and Transactional Machine Learning</font></i></h3></b></label>
</div>
</center>
</div>
<div class="row justify-content-md-center">
<div class="col-12">
<div id="selectSymbol">
<form id="idForm">
<h6>
<b><font color='black'>Last Kafka Access Time:</font></b></b> <label id="accesstime"></label><br>
<b><font color='black'>Kafka Cluster:</font></b> <label id="kafkacluster"></label><br>
</h6>
<div class="loader" id="loaderdiv" style="display:none;float: left"></div>
<button id="start" class="btn btn1" name="submit">Start Streaming</button>
<label id="statustext"></label>
<div style="float: right;display:block;" class="custom-switch custom-switch-label-io">
<label class="custom-switch-btn" for="example_1"></label>
</div>
</td>
</tr>
</table>
<!-- ********************************************************* DASHBOARD HEADER ******************************************** -->
<table border=0 style='width: 100%;height: 400px; vertical-align: top;'>
<tr>
<td >
<center>
<div class="tile wide job" style="width: 320px; height: 400">
<div class="header" style="width: 320px; height: 100%" >
<div id="totrecs" class="count">0</div>
<div class="title">Total Kafka Messages Processed</div>
</div>
</div>
<div class="tile wide job" style="width: 320px; height: 400">
<div class="header" style="width: 320px; height: 100%" >
<div id="tottime" class="counttimewindow"><br><br></div>
<div class="title">Kafka Time Window Analysed</div>
</div>
</div>
</center>
</td>
</tr>
<!-- *************************************** MAIN TABLE ****************************** -->
<tr>
<td colspan=4>
<table style="width: 100%;">
<tr>
<td>
<img src='./help.png' width=30 height=27 class="padding" style="float: top;" onclick="image('table','')">
<center><a id="Export" href="#"> Download as CSV </a> </center>
<div id="table_div"></div>
</td>
</tr>
</table>
</td>
</tr>
</table>
</form>
</div>
</div>
<i><b>Powered by:</b> Transactional Machine Learning, Kafka, Viper, Viperviz<br><b>Developed by:</b> OTICS Advanced Analytics, Inc.</i>
</div>
<!-- CONTAINER FOR CHART -->
<script src="https://ajax.googleapis.com/ajax/libs/jquery/3.4.1/jquery.min.js"></script>
<script src="https://stackpath.bootstrapcdn.com/bootstrap/4.3.1/js/bootstrap.min.js" integrity="sha384-JjSmVgyd0p3pXB1rRibZUAYoIIy6OrQ6VrjIEaFf/nJGzIxFDsf4x0xIM+B07jRM" crossorigin="anonymous"></script>
<script type="text/javascript" src="https://www.gstatic.com/charts/loader.js"></script>
<script>
// load current chart package
google.charts.load("current", {
packages: ["corechart", "line"]
});
google.charts.setOnLoadCallback(drawChart);
google.charts.load('current', {'packages':['table','annotatedtimeline','gauge','bar','sankey']});
google.charts.setOnLoadCallback(drawTable2);
document.documentElement.style.overflowX = 'hidden';
var START = 0;
var ws;
var topic = "";
var mainusertopic = "";
var offset = -1;
var append = 0;
var rollbackoffset = 0;
var topictype = "";
var vipertoken = "";
var consumerid = "";
var secure = 0;
var mainport = "";
//////////////////////////
// var data;
var datatbl;
var maintable;
var dataintable = [];
var kafkakeyarr = [];
var kafkacluster = "";
var issues = "";
var issuecount = 0;
var idkeyarr;
var maintotalmessages=0;
var timestart = "";
var timeend = "";
var icvals = [];
var maintimestamp = "";
var riskdatanum = 0;
var riskthreshold = 70;
var foundissues = []; // these are the preprocessed values
var mainriskhourstosave = 0;
var mainkafkatopic = "";
var pie = null;
// create options object with titles, colors, etc.
var cssClassNames = {
'headerRow': 'columnTitle',
'tableRow': '',
'oddTableRow': 'beige-background',
'selectedTableRow': 'orange-background large-font',
'hoverTableRow': '',
'headerCell': 'gold-border',
'tableCell': '',
'rowNumberCell': 'underline-blue-font'
};
<!-- ******************************************** DRAW CHART ********************************************* -->
function drawChart(jsondata, topic) {
issues = "";
issuecount = 0;
if (jsondata) {
var text;
var val;
var createdon;
var winstart;
var winend;
var symptom;
var processtype;
var identifier;
var idarr;
var symptomcode;
var processbuf;
var normalvalue;
var processvariable = "";
var ubound;
var predictionvalue;
var totalmessages;
var kafkakey;
var offset;
var partition;
var arr;
var st;
var ed;
var et;
var vbuf;
var buf;
var vbuf2;
var varr;
var msgiddatastr = "";
var Maintopic;
let rownum = 0;
for (j in jsondata.TopicReads) {
//get the fields
kafkakey = jsondata.TopicReads[j].kafkakey;
//try {
if (kafkakey != null && !kafkakeyarr.includes(kafkakey) && kafkakey.length > 0) {
kafkakeyarr.push(kafkakey);
createdon = jsondata.TopicReads[j].TimeStamp;
maintimestamp = createdon;
winstart = jsondata.TopicReads[j].WindowStartTime;
timestart = winstart;
winend = jsondata.TopicReads[j].WindowEndTime;
timeend = winend;
msgiddata = jsondata.TopicReads[j].MsgIdData;
if (msgiddata) {
msgiddatastr = msgiddata.join();
}
try {
processvariable = jsondata.TopicReads[j].Identifier;
processvariable = processvariable.split("~")[0];
} catch (e) {
continue;
}
//}
processtype = jsondata.TopicReads[j].Preprocesstype;
identifier = jsondata.TopicReads[j].Identifier;
idarr = identifier.split("~");
//symptomcode = idarr[0];
topic = jsondata.TopicReads[j].Topic;
Maintopic = jsondata.TopicReads[j].Maintopic;
processbuf = "_preprocessed_" + processtype;
predictionvalue = jsondata.TopicReads[j].hyperprediction;
totalmessages = jsondata.TopicReads[j].Numberofmessages;
kafkakey = jsondata.TopicReads[j].kafkakey;
offset = jsondata.TopicReads[j].Offset;
partition = jsondata.TopicReads[j].Partition;
predictionvalue = Number(predictionvalue);
// datainchart.push(predictionvalue)
arr = [createdon, winstart, winend, msgiddatastr, processvariable, processtype, predictionvalue, totalmessages, kafkakey, offset, partition];
dataintable.push(arr)
rownum++;
predictioncount = predictioncount + 1;
}
}
maintotalmessages = maintotalmessages + rownum;
document.getElementById('totrecs').innerHTML = maintotalmessages;
document.getElementById('tottime').innerHTML = "<font size=3><b>Start:</b> " + timestart + "<b><br>End:</b> " + timeend + "</font>"
drawTable2();
}
// i=null;
text = null;
val = null;
// partitionarr=null;
kafkakey = null;
createdon = null;
winstart = null;
winend = null;
symptom = null;
processtype = null;
identifier = null;
idarr = null;
symptomcode = null;
// topic=null;
processbuf = null;
normalvalue = null;
ubound = null;
predictionvalue = null;
totalmessages = null;
rownum = null;
offset = null;
partition = null;
arr = null;
st = null;
ed = null;
et = null;
vbuf = null;
buf = null;
vbuf2 = null;
varr = null;
}
<!-- ******************************************** DRAW CHART ********************************************* -->
<!-- ******************************************** DRAW TABLE ********************************************* -->
function drawTable2() {
if (maintable == null) {
maintable = new google.visualization.Table(document.getElementById('table_div'));
}
var formatter = new google.visualization.NumberFormat({
groupingSymbol: '',
fractionDigits: 0
});
var formatter2 = new google.visualization.NumberFormat({
groupingSymbol: '',
fractionDigits: 3
});
if (datatbl == null) {
datatbl = new google.visualization.DataTable();
datatbl.addColumn('string', 'Date/Time');
datatbl.addColumn('string', 'Time Window Start');
datatbl.addColumn('string', 'Time Window End');
datatbl.addColumn('string', 'Subject Information');
// datatbl.addColumn('string', 'Symptomcode');
datatbl.addColumn('string', 'ProcessVariable');
datatbl.addColumn('string', 'Processtype');
datatbl.addColumn('number', 'Current Value');
//datatbl.addColumn('number', 'Normal Mean Value');
//datatbl.addColumn('number', 'Upper Bound Value');
datatbl.addColumn('number', 'Total Messages');
datatbl.addColumn('string', 'Kafkakey');
datatbl.addColumn('number', 'Offset');
datatbl.addColumn('number', 'Partition');
datatbl.sort({
column: 1,
desc: true
});
maintable.clearChart();
maintable.draw(datatbl, {
showRowNumber: true,
width: '100%',
height: '100%',
page: 'enable',
pageSize: 30,
allowHtml: true
});
if (append == 0) {
datatbl.removeRows(0, datatbl.getNumberOfRows() - 1);
}
} else {
//console.log("datatbl=",datatbl);
formatter.format(datatbl, 1);
formatter2.format(datatbl, 2);
datatbl.sort({
column: 1,
desc: true
});
if (datatbl.getNumberOfRows() > 0 && append == 0) {
datatbl.removeRows(0, datatbl.getNumberOfRows() - 1);
}
datatbl.addRows(dataintable);
maintable.clearChart();
maintable.draw(datatbl, {
showRowNumber: true,
width: '100%',
height: '100%',
page: 'enable',
pageSize: 30,
allowHtml: true,
'cssClassNames': cssClassNames
});
formatter = null;
formatter2 = null;
//datatbl=null;
}
dataintable = [];
}
<!-- ******************************************** DRAW TABLE ********************************************* -->
<!-- ***************************************** START MAIN STREAMING FUNCTION ************************************************ -->
function streamLiveKafkaData() {
if ("WebSocket" in window) {
var url = window.location.host;
console.log(url);
mainport = url.split(":")[1];
//console.log(mainport);
<!-- ******************************* GRAB PARAMETERS FROM URL *************************** -->
var urlParams = new URLSearchParams(window.location.search);
var keys = urlParams.keys();
var entries = urlParams.entries();
for (pair of entries) {
if (pair[0] == "topic") {
topic = pair[1];
}
if (pair[0] == "topictype") {
topictype = pair[1];
}
if (pair[0] == "secure") {
secure = pair[1];
}
if (pair[0] == "vipertoken") {
vipertoken = pair[1];
}
if (pair[0] == "consumerid") {
consumerid = pair[1];
}
if (pair[0] == "offset") {
offset = pair[1];
}
if (pair[0] == "rollbackoffset") {
rollbackoffset = pair[1];
}
if (pair[0] == "groupid") {
groupid = pair[1];
}
if (pair[0] == "append") {
append = pair[1];
}
}
<!-- ************************************* CREATE WEBSOCKET OBJECT **************************** -->
if (window.location.href.indexOf("http://") != -1) {
ws = new WebSocket("ws://" + url + "/ws");
} else {
ws = new WebSocket("wss://" + url + "/ws");
}
<!-- ************************************* CREATE WEBSOCKET OBJECT **************************** -->
<!-- ************************************* CREATE WEBSOCKET EVENTS **************************** -->
ws.onmessage = function (event) { <!-- ON MESSAGE SOCKET EVENT ****************** -->
curTime = new Date();
var eventdata = `${event.data}`; <!-- ******** REAL-TIME DATA FROM VIPERVIZ ** -->
var maindata = eventdata.replace(/\\"/g, '"');
maindata = maindata.substr(1, maindata.length - 3);
if (maindata == "") {
return;
}
var obj; <!-- ************ MAIN DATA FROM VIPERVIZ - Cleaned Up *********** -->
try {
obj = JSON.parse(maindata);
} catch (e) {
console.log("Json parse issue=", e.message);
return;
}
if (obj.ERROR) {
document.getElementById('statustext').innerHTML = "Websocket ERROR.." + obj.ERROR;
ws.close(1000);
alert(obj.ERROR);
ws = null;
$("#start").attr("disabled", false);
$("#start").html("Start Streaming");
return
}
<!-- ************************************ SUCCESSFULLT RECEIVED MAIN DATA FROM VIPERVIZ *********** -->
if (START == 0) {
if (ws) {
ws.close(1000);
}
ws = null;
return;
}
if (append == 0) {
dataintable.splice(0, dataintable.length)
predictioncount = 0;
jsonhist = null;
kafkakeyarr.splice(0, kafkakeyarr.length)
}
kafkacluster = obj.Webkafkacluster
mainkafkatopic = obj.Webtopic
document.getElementById('accesstime').innerHTML = curTime;
document.getElementById('kafkacluster').innerHTML = kafkacluster + ", Kafka Topic: " + obj.Webtopic;
mainusertopic = topic;
<!-- **************************************** START THE VISUALIZATION **************************** -->
drawChart(obj, mainkafkatopic);
<!-- **************************************** START THE VISUALIZATION **************************** -->
obj = null;
maindata = null;
eventdata = null;
superidentifiermap = null;
};
<!-- ****************************************** ON CLOSE SOCKET EVENT ****************** -->
ws.onclose = function (event) {
//console.log("event=",event);
if (event.wasClean) {
console.log(`[close] Connection closed cleanly, code=${event.code} reason=${event.reason}`);
} else {
console.log('[close] Connection died');
}
if (ws) {
ws.close(1000);
}
ws = null;
var el = document.getElementById('loaderdiv');
el.style.display = "none";
$("#start").attr("disabled", false);
//$("#statustext").val("Websocket closed");
document.getElementById('statustext').innerHTML = "WEBSOCKET Closed";
$("#start").html("Start Streaming");
};
<!-- ****************************************** ON CLOSE SOCKET EVENT ****************** -->
<!-- ****************************************** ON OPEN SOCKET EVENT ****************** -->
ws.onopen = function (error) {
var password = ""
var sendbuffer = "{\"Topic\":\"" + topic + "\",\"Topictype\":\"" + topictype + "\",\"Secure\":" + secure + ",\"Vipertoken\":\"" + vipertoken + "\",\"Consumerid\":\"" + consumerid + "\",\"Offset\":\"" + offset + "\",\"RollbackOffset\":\"" + rollbackoffset + "\",\"Groupid\":\"" + groupid + "\"}";
ws.send(sendbuffer);
var el = document.getElementById('loaderdiv');
el.style.display = "block";
};
<!-- ****************************************** ON OPEN SOCKET EVENT ****************** -->
<!-- ****************************************** ON ERROR SOCKET EVENT ****************** -->
ws.onerror = function (error) {
if (ws) {
ws.close(1000);
}
console.log(`[error] ${error.message}`);
// $("#statustext").val("WEBSOCKET ERROR.."+`[error] ${error.message}`);
document.getElementById('statustext').innerHTML = "WEBSOCKET ERROR.." + `[error] ${error.message}`;
};
<!-- ****************************************** ON ERROR SOCKET EVENT ****************** -->
} else { <!-- **************** WEBSOCKET ERROR *************************** -->
// The browser doesn't support WebSocket
console.log("WebSocket NOT supported by your Browser!");
}
}
$('#Export').click(function () {
if (topic.length > 0) {
var headerRow = "";
var number_of_columns = datatbl.getNumberOfColumns();
for (var i = 0; i < number_of_columns; i++) {
headerRow += datatbl.getColumnLabel(i).replace("\n", " : ");
headerRow += (i === number_of_columns - 1) ? "\n" : ",";
}
var csvFormattedDataTable = headerRow + google.visualization.dataTableToCsv(datatbl);
var encodedUri = 'data:application/csv;charset=utf-8,' + encodeURIComponent(csvFormattedDataTable);
this.href = encodedUri;
this.download = "iot-data.csv";
this.target = '_blank';
} else {
alert("Start streaming first");
}
});
$("#idForm").submit(function (e) {
if (ws && START == 1) {
ws.close(1000);
ws = null;
e.preventDefault(); // avoid to execute the actual submit of the form.
START = 0;
$("#start").html("Start Streaming");
$("#start").attr("disabled", true);
// $("#statustext").val("WEBSOCKET CLOSING...");
document.getElementById('statustext').innerHTML = "WEBSOCKET CLOSING...";
} else {
e.preventDefault(); // avoid to execute the actual submit of the form.
START = 1;
// $("#statustext").val("WEBSOCKET OPEN..Receiving Kafka Msgs...");
document.getElementById('statustext').innerHTML = "WEBSOCKET OPEN..Receiving Kafka Msgs...";
$("#start").html("Stop Streaming");
streamLiveKafkaData();
}
});
</script>
</body>
</html>
18.4. More Dashboard Examples
More examples are here: https://github.com/smaurice101/raspberrypi/tree/main/tml-airflow/dashboard